Source:
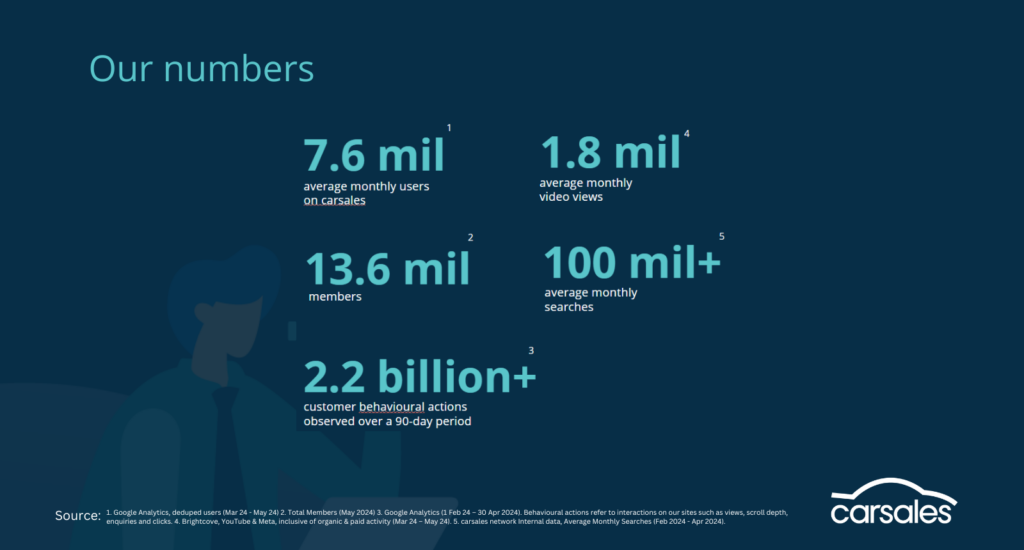
1 Google Analytics, deduped Users (Mar 24 – May 24)
2 Ipsos Iris, Visits (May 24)
3 Google Analytics, App Sessions (Mar 24 – May 24)
4 Apple App Store and Google Play (Feb 24 – Apr 24)
5 Ipsos Iris, Average Time on Site, (Monthly Numbers), May 2024.
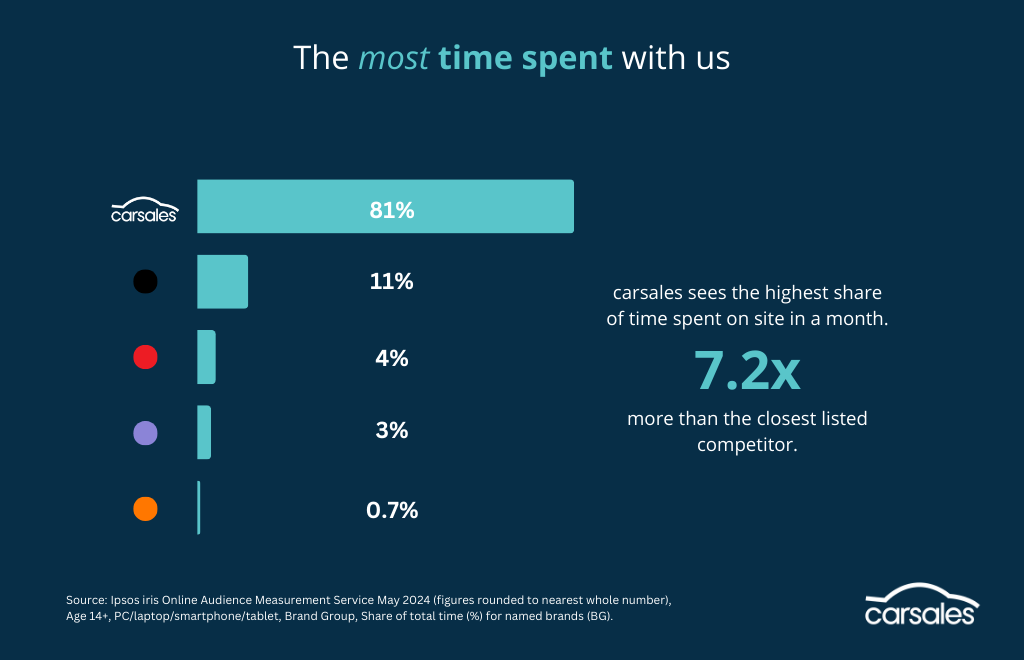
6 Ipsos Iris Online Audience Measurement Service May 2024 (figures rounded to nearest whole number), Age 14+, PC/laptop/smartphone/tablet, Brand Group, Share of total time (%) for named brands (BG).